Intro

A Data Analyst with a strong passion for transforming raw data into insightful, actionable intelligence. With a solid foundation in data analysis tools like Power BI, Excel, and SQL, I specialize in creating interactive dashboards, detailed reports, and visualizations that help businesses and organizations make data-driven decisions
My expertise spans data cleaning, exploratory analysis, and storytelling with data, which allows me to effectively uncover trends,patterns and opportunities hidden within complex datasets. I combine analytical thinking with a strong visual sense to deliver insights that are not only accurate but also easy to understand and act on.
NETFLIX 2023 CONTENT ANALYSIS
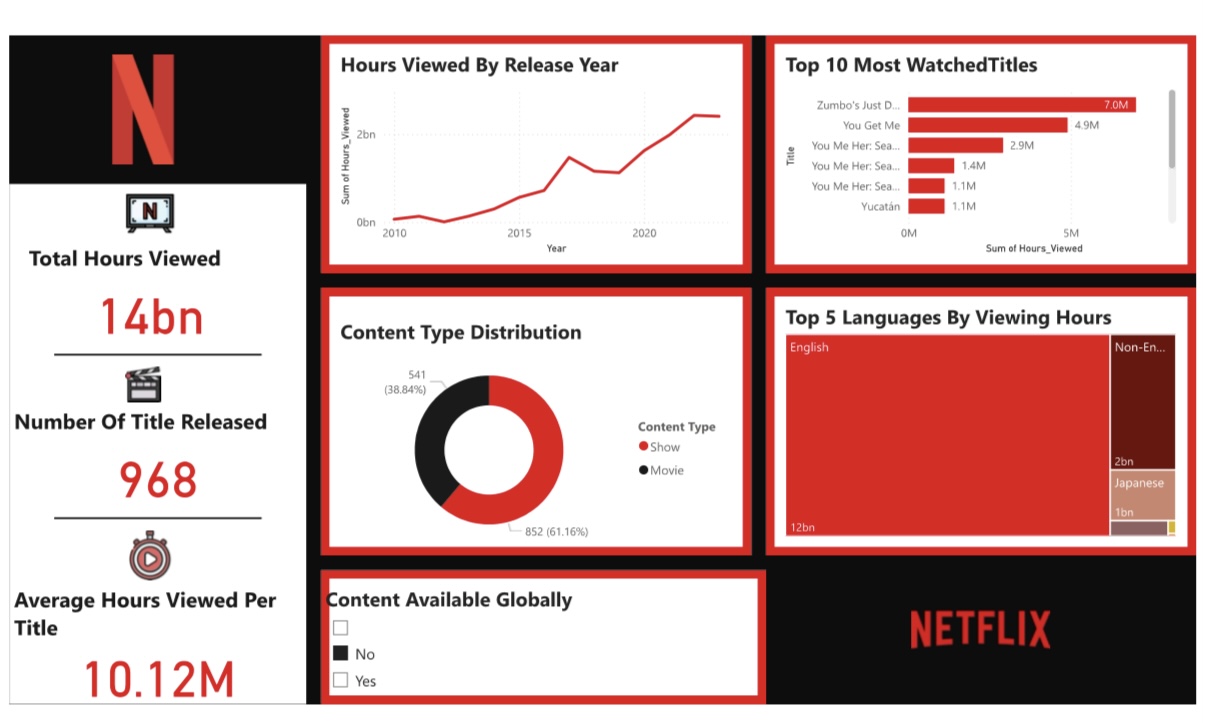
Designed an interactive Power BI dashboard to explore Netflix's 2023 content idea. Key insights include viewing trends, top-performing titles, language popularity, and content type distribution. Styled with a Netflix-themed red and black design, the dashboard delivers clear, engaging analytics with slicers and tooltips for easy exploration
MONDELEZ SALES OVERVIEW(2024)
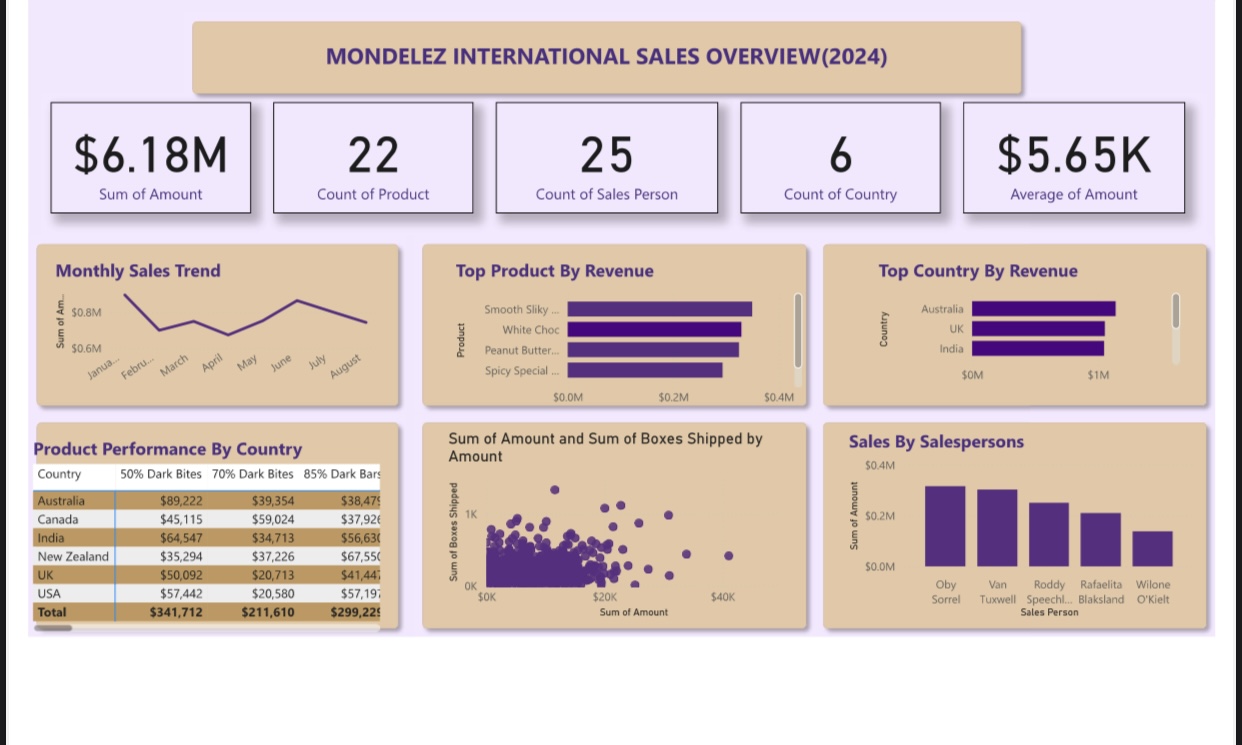
This Power BI dashboard presents a comprehensive analysis of chocolate sales for Mondelēz International across five countries. It highlights key performance indicators such as total sales, boxes shipped, and average revenue per shipment, while offering interactive visuals to explore monthly trends, top-performing products, and sales rep performance.
Designed with a brand-aligned color palette, the dashboard includes advanced analytics like correlation between sales volume and revenue, delivering both high-level insights and granular detail. The project showcases skills in data modeling, DAX, visual storytelling, and business intelligence.
HOSPITAL RESOURCES MANAGEMENT
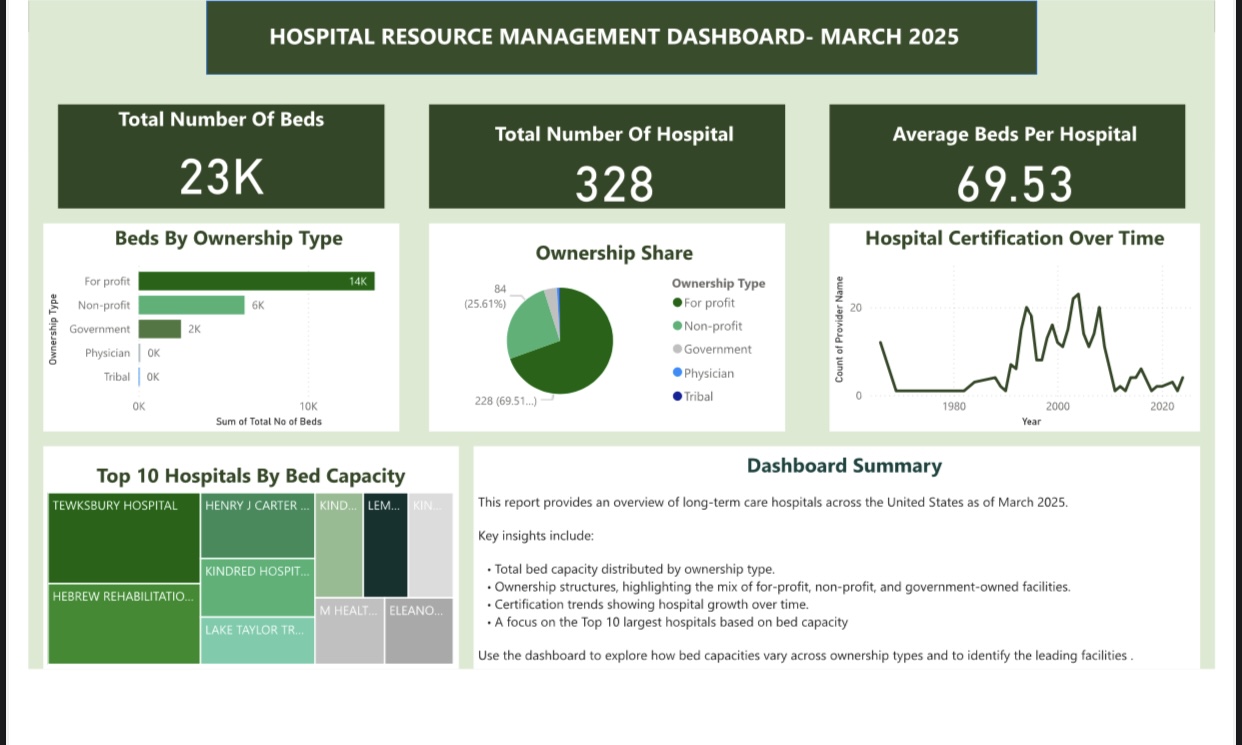
Designed and developed a hospital resource management dashboard using Power BI. The dashboard analyzes hospital bed capacity, ownership distribution, and certification trends across the United States as of March 2025.
Key features include dynamic visualizations (bar charts, pie charts, treemaps, and line graphs), ownership breakdowns, and top hospital analysis by bed capacity.
Focused on clear storytelling, insightful metrics, and clean design to support healthcare management decision-making
Healthcare Dashboard
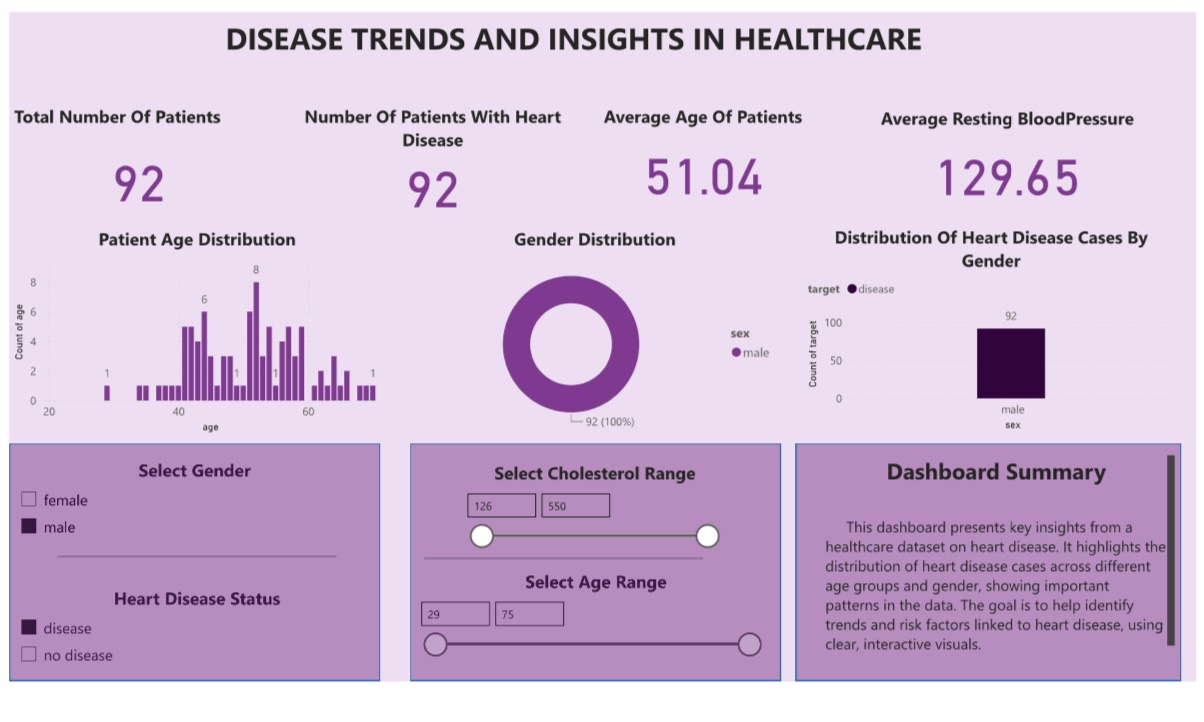
The Diabetes Healthcare Dashboard is an interactive Power BI project that visualizes critical metrics related to diabetic patients. It provides insights into patient demographics, admission types, insulin usage, and readmission rates, helping healthcare professionals identify trends and make data-driven decisions. The dashboard uses data filtering and dynamic visuals to highlight high-risk groups, treatment patterns, and outcome distributions, making complex data more accessible and actionable.
I was responsible for the complete dashboard development, including data cleaning, transformation, visualization, and user experience design. Using Power BI, DAX, and Power Query, I built a user-friendly interface that allows for deep dives into patient data by age, gender, or race. This project demonstrates my ability to turn raw healthcare data into meaningful insights that support better clinical outcomes and strategic planning.
About
With a background in Botany and a passion for problem-solving, I transitioned into data analytics to help organizations make smarter, data-driven decisions. I specialize in turning raw data into clear insights through tools like PowerBI, SQL, and Excel.
I'm currently building a portfolio focused on healthcare and finance projects, where I apply data cleaning, visualization, and storttelling to uncover meaningful patters. Outside of work, I enjoy learning, growing, and staying curious.
Contact
Elements
Text
This is bold and this is strong. This is italic and this is emphasized.
This is superscript text and this is subscript text.
This is underlined and this is code: for (;;) { ... }. Finally, this is a link.
Heading Level 2
Heading Level 3
Heading Level 4
Heading Level 5
Heading Level 6
Blockquote
Fringilla nisl. Donec accumsan interdum nisi, quis tincidunt felis sagittis eget tempus euismod. Vestibulum ante ipsum primis in faucibus vestibulum. Blandit adipiscing eu felis iaculis volutpat ac adipiscing accumsan faucibus. Vestibulum ante ipsum primis in faucibus lorem ipsum dolor sit amet nullam adipiscing eu felis.
Preformatted
i = 0;

while (!deck.isInOrder()) {
    print 'Iteration ' + i;
    deck.shuffle();
    i++;
}

print 'It took ' + i + ' iterations to sort the deck.';
Lists
Unordered
- Dolor pulvinar etiam.
- Sagittis adipiscing.
- Felis enim feugiat.
Alternate
- Dolor pulvinar etiam.
- Sagittis adipiscing.
- Felis enim feugiat.
Ordered
- Dolor pulvinar etiam.
- Etiam vel felis viverra.
- Felis enim feugiat.
- Dolor pulvinar etiam.
- Etiam vel felis lorem.
- Felis enim et feugiat.
Icons
Actions
Table
Default
| Name |
Description |
Price |
| Item One |
Ante turpis integer aliquet porttitor. |
29.99 |
| Item Two |
Vis ac commodo adipiscing arcu aliquet. |
19.99 |
| Item Three |
Morbi faucibus arcu accumsan lorem. |
29.99 |
| Item Four |
Vitae integer tempus condimentum. |
19.99 |
| Item Five |
Ante turpis integer aliquet porttitor. |
29.99 |
|
100.00 |
Alternate
| Name |
Description |
Price |
| Item One |
Ante turpis integer aliquet porttitor. |
29.99 |
| Item Two |
Vis ac commodo adipiscing arcu aliquet. |
19.99 |
| Item Three |
Morbi faucibus arcu accumsan lorem. |
29.99 |
| Item Four |
Vitae integer tempus condimentum. |
19.99 |
| Item Five |
Ante turpis integer aliquet porttitor. |
29.99 |
|
100.00 |